

Data Interaction tool
A tool that helps people who don’t know Analysis do Analysis.
Data analysis should not only be useful, but also fun!
A quick overview
Time:
April 2022-Sep 2022
5 Months
My Role:
Interaction design
User research
Product strategy planning
Design planning
Deliver end-to-end specs
Design review
Team:
UI designer
Frontend engineers
Product manager
Product architect
Director of Solution engineers
Copy writer & Product Doc
Goal
Design a seamless interaction experience on the dashboard to empower user click to dig into underlying data, filter in demand, and a user-friendly tool directly wire data elements.
Challenge
Implementing interaction cross different data elements on the dashboard is a complex process, and that will influence user adoption. We need to find a way to balance the complexity of the set up with giving people the breath of functionality we want to support.
My Process for every implemented iteration:

Build interaction groups with 4 steps
Step 1: Build the analysis

Step 2: Create an action group with elements to interact

Step 3: Define the relationship of the elements

Click on the values in source will send signal to filter / Highlight target elements
An element can be both source and target in a group
Target element are able to receive the highlight / filter signal from source element
Step 4- Custom Data Mapping
Step 4.1: Select the value you want to match

Step 4.2: Select columns in different element to match the value

User Flow of Interaction Builder

User Research
Who are the users
Data Analyst
SQL and BI tool savvy (not a software engineer). Responsible for building reports, and dashboards. Finds value in getting certified or having experience with a range of BI tools.
Use case
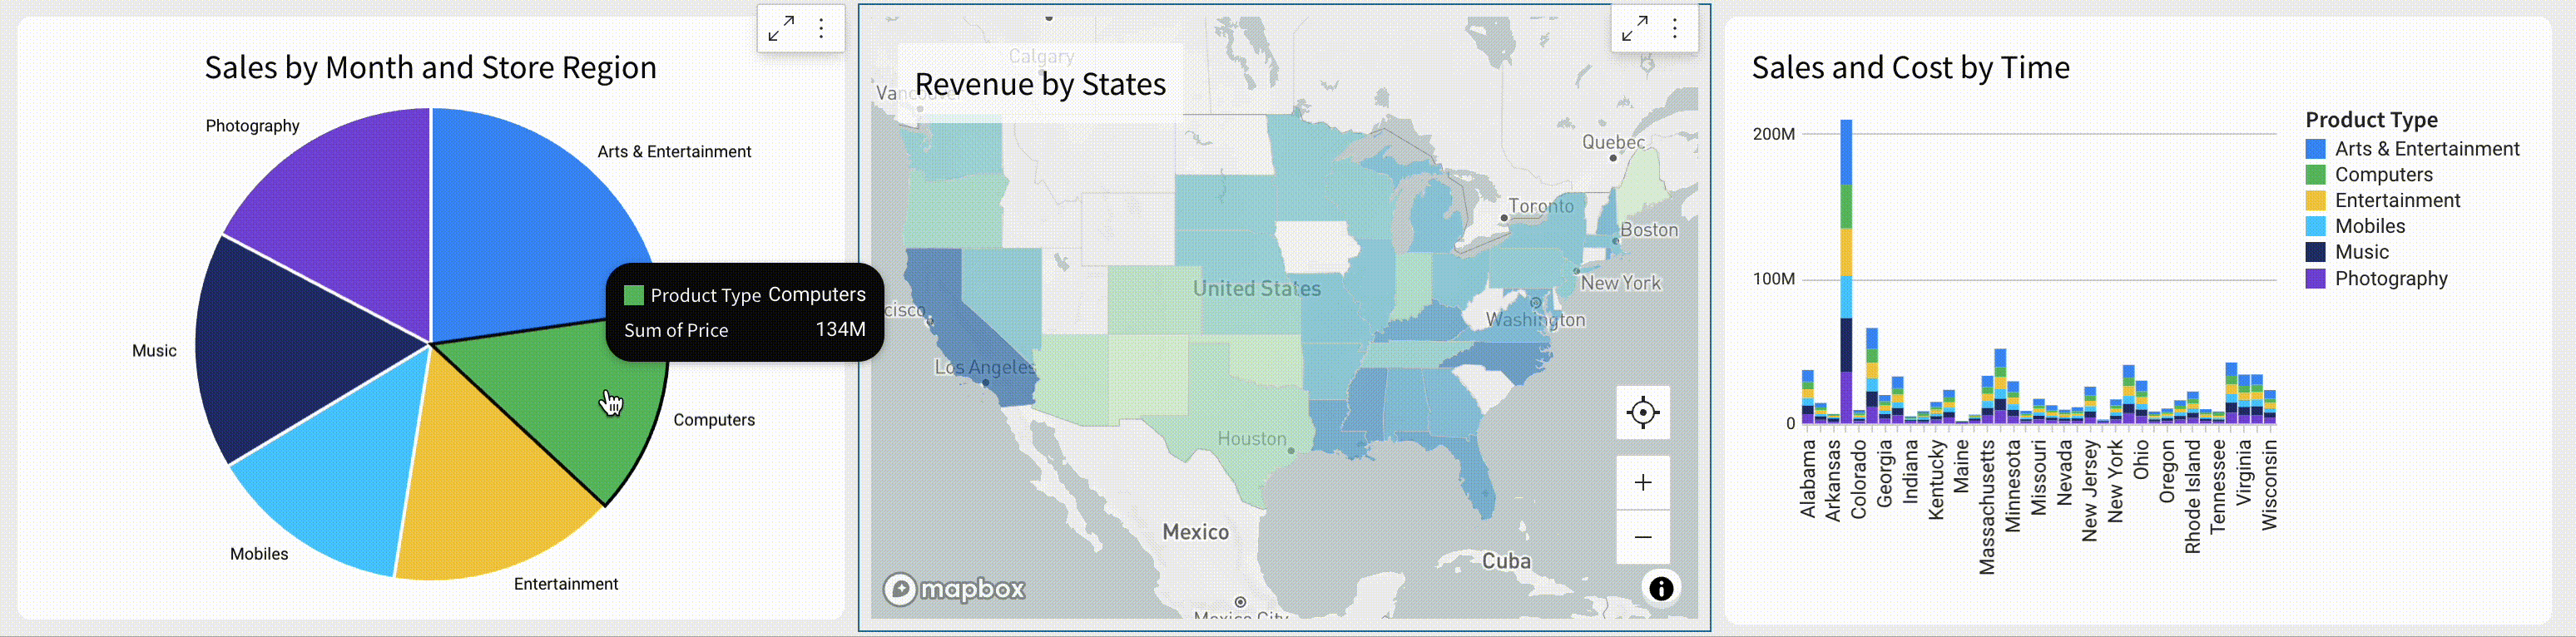
User A has several visualizations that show various metrics broken out by region and a table that shows all sales data. They can easily set it up so that when a region is selected on one graph, it is highlighted on all the visualizations, and the table is filtered to show just the region.
Business Analysts
Non-Analyst Employee
Excel savvy (neither SQL nor coding savvy). Has a very deep LoB-specific context and works with the same few data sets most of the time. Tend to have strong business intuition.
-
Explorer A clicks on the ‘West’ region on a bar chart, and it filters the table next to the chart to just show the West region. Explorer A can click “Column Details” to see the summary of just the West regional values.
-
Explorer A clicks on the ‘West’ region on a bar chart. Several visualizations change. Explorer A can look and understand which visualizations have been affected by their selection.
-
Explorer A clicks on the ‘West’ region on a bar chart. They see that several visualizations are affected. They click to interact with some other charts. They then deselect everything.
Competitor Analysis
Inspirations


Power BI
Rule: By default wire all of the elements together, user can define an element will be highlighted / filtered / do nothing
Limit: All elements sharing the same data source
Things we could learn: lower hierarchy category will partially highlight the higher level hierarchy and show the proportion of the value

MicroStrategy
Rule: User can define an element as a source element, then from source element user can define it’s target element, as well as the interaction type: whether highlight or filter
Limit: The element in the dashboard is limited in one page view. so it when user set up, they have a overview of all elements.
Things we could learn: The source and target relationships is very clear here.

Tableau
Rule: Tableau gives user an shortcut to set an element as a filter. It also allows user to define an group that can wire elements toegther
Limit: same as PowerBI
Things we could learn: The action group is actually very efficient, but the set up is very complex, can we make it easier?
An example of a design thinking driven decision making process :
Should the second interaction override the first one or not?
This is a debate that happened during the development of this feature. Stakeholders are divided into 2 groups. People are debating a default behavior that blocks the implementation.
I think every time when user make a selection by default selected value should persist until user opt out from the same element. I have the use case that sometimes we need multi-step drill down.
Stakeholder 1:
Represent Novice Users
Stakeholder 2:
Represent Professional analyst
I think every time when user make a selection by default selected value should persist until user opt out from the same element. I have the use case that sometimes we need multi-step drill down.
Design Thinking process:
Who is the primary user? Are those concerns really valid? After we satisfied the need of the primary user, is it possible we can also satisfy the other use case?
Step 1
Based on the initial research: the primary user of the interaction itself are viewers. Those people are business analysts or non-analyst employees. The majority of them are Noice Users.
Step 2
To get a better validation of user intention. I interviewed users on what's the daily workflow with cross-interaction function and what they expect in given situation

The research result shows, no matter whether it's a novice user or a professional user, both expect the selection could be persistent 😱. Which means we should go with the persistency solution. Bu, the concern towards the complex drill down flow, is valid: is it possible user might get confused by the multi-step drill flow (no matter novice or professional user)
Step 3
Selection persistency should not be an excuse for user confusion. Combined with all of the research I have done. I found out that if the selection is persistent, the User's main concern is how they know which value is selected and how do they clear it.
Give user a shortcut to clear the selection from target element
Element 1
Element 2
Element 3
Source
Source
Target
Using the Gif action as an example, after users select a value from element 1/2, they can see the value filtered on element 3. When they open the filter panel in element 3, they can clear the filter directly, once they cleared the filter, the selection will be cleared as well to keep data selection consistent
An example of a data driven decision making:
During the design process, I will design based on many assumptions. That assumption might be correct or not which will influence the usability of this function a lot. I worked with an engineer implementing a series of tracking events that can help this feature iterate and validate those assumptions.
🧐 List of questions I have
High level:
-
Does this function reduce the user’s dependence on dashboard controls?
-
What is the adoption rate?
-
How well do people continually use this function?
-
Who is using this function?
Detail level:
-
How many user used interact with data through this function?
-
How many user edited an action group?
-
How many dashboard that implemented cross interaction function?
-
How many action groups in a dashboard?
-
How many element in each action group?
-
For each element
-
Which page are those elements in?
-
What is the role of this element in the action group?
-
What is their lineage relationship with other element in this group?
-
-
Usage data analysis

Due to sensitive custom data, i can't show the screen shot of the analysis. I will general explain how did I do the analysis
Analysis included: Customer Usage / Feature Adoption / Error Analysis / User flow analysis
Part of Key metric data

💡 Key insight
-
This feature gets a decent adoption rate.
-
User flow gets simplified after action group logic is changed 👍
-
Viewers are not informed that cross-element action has been implemented👎
-
More than 80% of the element has a lineage relationship, can we use this to simplify the wire flow?
-
In more than 50% of action group, the max-min edit time log is longer than 5 days, what makes people keep editing the action group? 🤔
Actions taken afterwards.
-
Allow users to select parent elements to auto-apply actions to their child elements, so they don’t need to add child elements one by one.
-
Education functions have been added to better inform the user how can they interact with the element.
-
Auto collapse action group by default to give users better visibility of the big picture.
-
Add a preview in the tooltip when the user hover over an element name to give the user more context